Tuesday 21st April is World Creativity and Innovation Day supported by the United Nations and aligned to the UN’s sustainable development goals. Jersey is involved with a UN project that is perfectly aligned to these criteria and it’s all about data.
Joel Mills, the CEO of AugmentCity, is a man with a vision and a mission. He wants to turn the mounds of data that we produce, into something which isn’t just for machines to understand but something that humans can ingest and make informed decisions with. He explains, ‘We are getting more and more data from the world we’re living in, there are sensors everywhere and the information coming from them is very overwhelming. Lots of people talk about big data but there’s very little understanding about what it is and how it can help us. What we are trying to do is present the data we are collecting, in a way that it can be used to understand everyone’s lives better.’
Up to now, a lot of the ideas for using data have revolved around how machines can process it and not how human beings are able to understand it. We are visual creatures, much better at picking out trends than machines are, and we do this by taking in information in a graphical way. On a daily basis we input huge amounts of data, but visualising it is important. We could read a 100 page report by the world’s best experts, but be not much wiser at the end because our brain hasn’t been able to process the critical information in the right way. Put that data into a graphical form and it helps us to see the patterns and to connect the dots so we can understand it far easier.
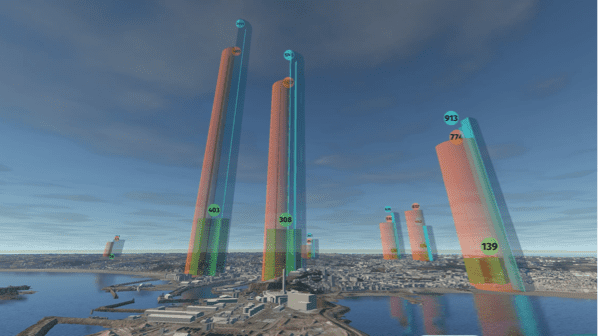
The story of AugmentCity started in the offshore oil industry where the high risks and quick decision making nature of the environment needed an innovative solution. Joel and his team created a digital twin – or complete 3D copy – of the environment and then input all the data they had into that. They literally put the data over the top of a real-life scenario and were able to show the effect that different changes to various elements would make.
Joel, then took this a stage further. He knew there is a huge amount of data sitting on computers that could be making everyone’s lives better, but it is inaccessible and indigestible. He created a digital twin of his own city in Norway, ‘So many decisions are based on people’s gut feelings rather than physical data. How have we got a chance to improve if we don’t understand where we are today? Our work allows us to not only understand where we are and visualise it, but it allows us to see what would happen if we changed this or that. For example, would altering the bus system by using smaller buses that were more frequent improve public transport? If we put in more bicycle lanes what would that do etc. It allows us to simulate the various issues and how they are interconnected to the whole system. Often when you talk to a town planner etc they are very good at what they are looking at but struggle to see the big picture.’
Just over a year ago, by coincidence there was a visit to their city by Kari Eik leader of the UN’s Organization for International Economic Relations. Kari saw Joel’s simulators and invited him to speak in Geneva, from there he was asked to get involved with the United 4 Smart Sustainable Cities, initiative, a global programme aimed at encouraging information and communication technologies that improve the quality of life and make more efficient urban environments.
A list of KPIs have been compiled which will analyse if a city is smart and sustainable, and that will be the benchmark on which the cities are measured. Jersey was chosen to be one of the pilot territories for the project. ‘Jersey is very well connected with internet, you’d struggle to beat that, but you might not be so good at something else. Public transport only has 6% of people using it which isn’t a very good figure for the future.
‘Here, in Norway, we have a traffic issue like Jersey. The solution in the past is often to decrease vehicles or increase roads. What we did was try to understand what is the peak flow which in our case is lots of people delivering children to daycare. Many people can work flexi hours but they are having to keep to rush hour because of opening times of childcare. So we did some studies with the digital twin and found that if we changed the opening hours of nurseries and certain schools, we could reduce that peak rush hour by 50% and by doing that we can increase the response time for the emergency services in that rush hour by over 50%. So it’s about looking at how things are interconnected and sometimes it takes you to a novel approach that you would never have seen if you were still focusing on your one area.’
Humans are able to use their creative thinking through the graphical input of data, to out think machines and artificial intelligence by seeing the big picture and the trends that connect individual issues. Joel will soon be delivering the first prototype of Jersey’s digital twin to Digital Jersey and the Island’s Government. It’s hoped that within the year the public will also be able to interact with this real-life graphical Island – an innovative and creative use of data that will bring great benefits to us all.


